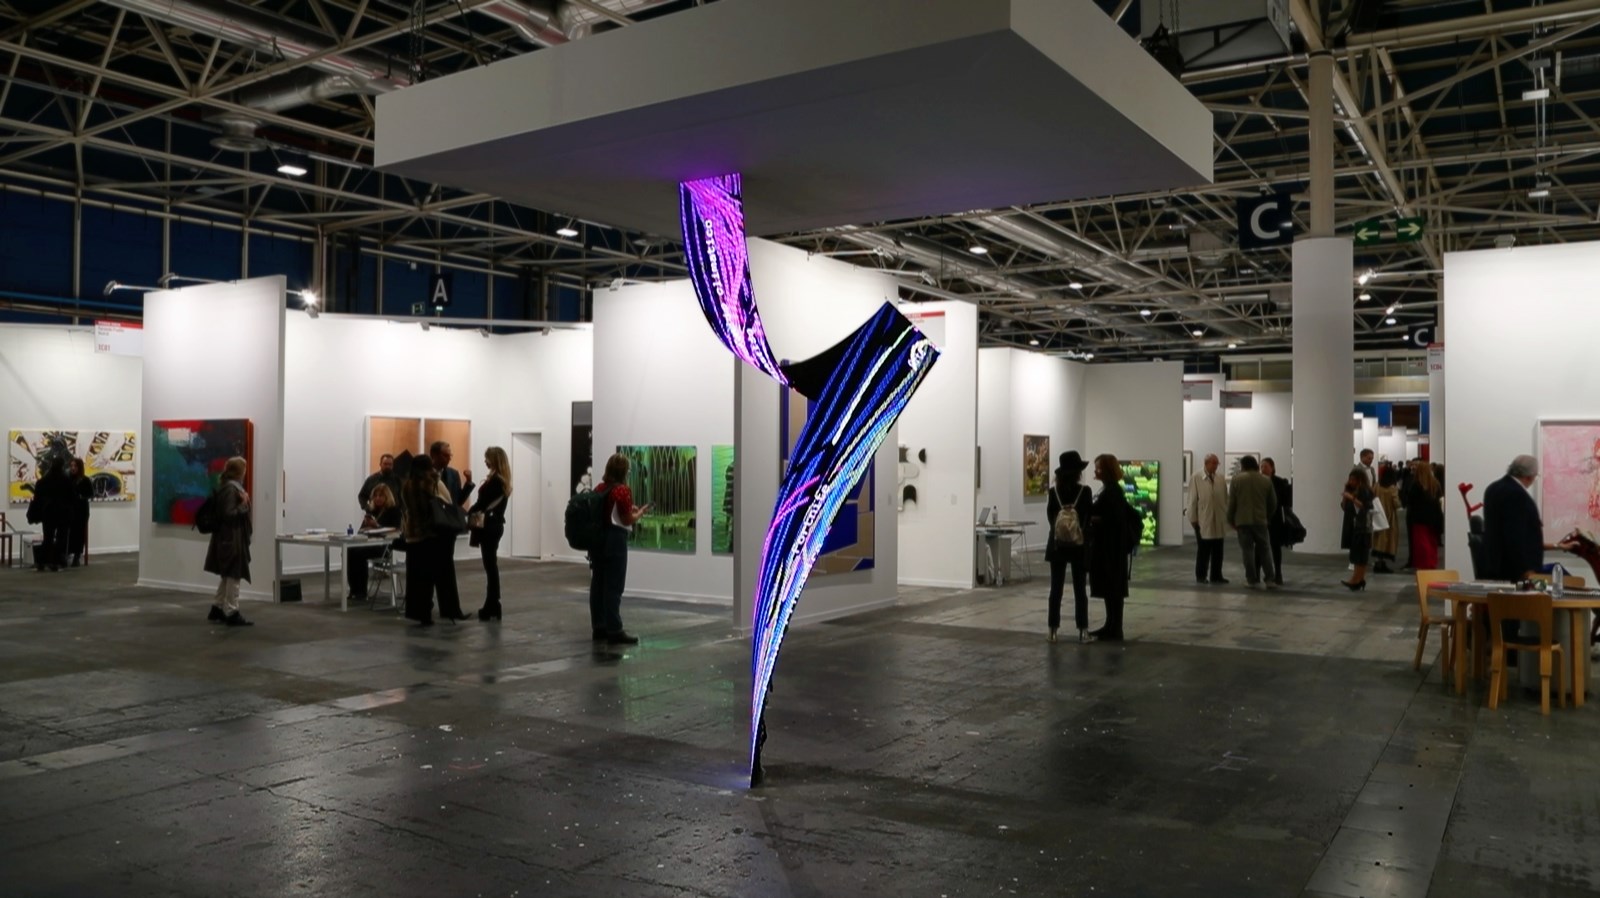
Daniel Canogar was the guest artist at Estampa contemporary art fair, which was held from 17-20 October at the IFEMA exhibition centre. The artist presented Surge in which he explores how the world of data negotiates its relationship with the physical world. The project emerges from the artist’s preoccupation with the intangible – and invisible - nature of one of the main driving forces of our economy and society: the data-sphere. This “crisis of visibility” makes it very difficult for most of the population to comprehend how big data is impacting their lives. To materialize the world of data is an attempt to help us cognitively incorporate this new reality.
The screens become conduits of data related to real-time Google Trends searches, a service that provides interest over time of different topics. The artwork displays the relative percentual interest between 4 topics, rather than feature the absolute number of queries around a specific topic. The artwork is interactive: viewers can introduce their own topics via a wireless keyboard.
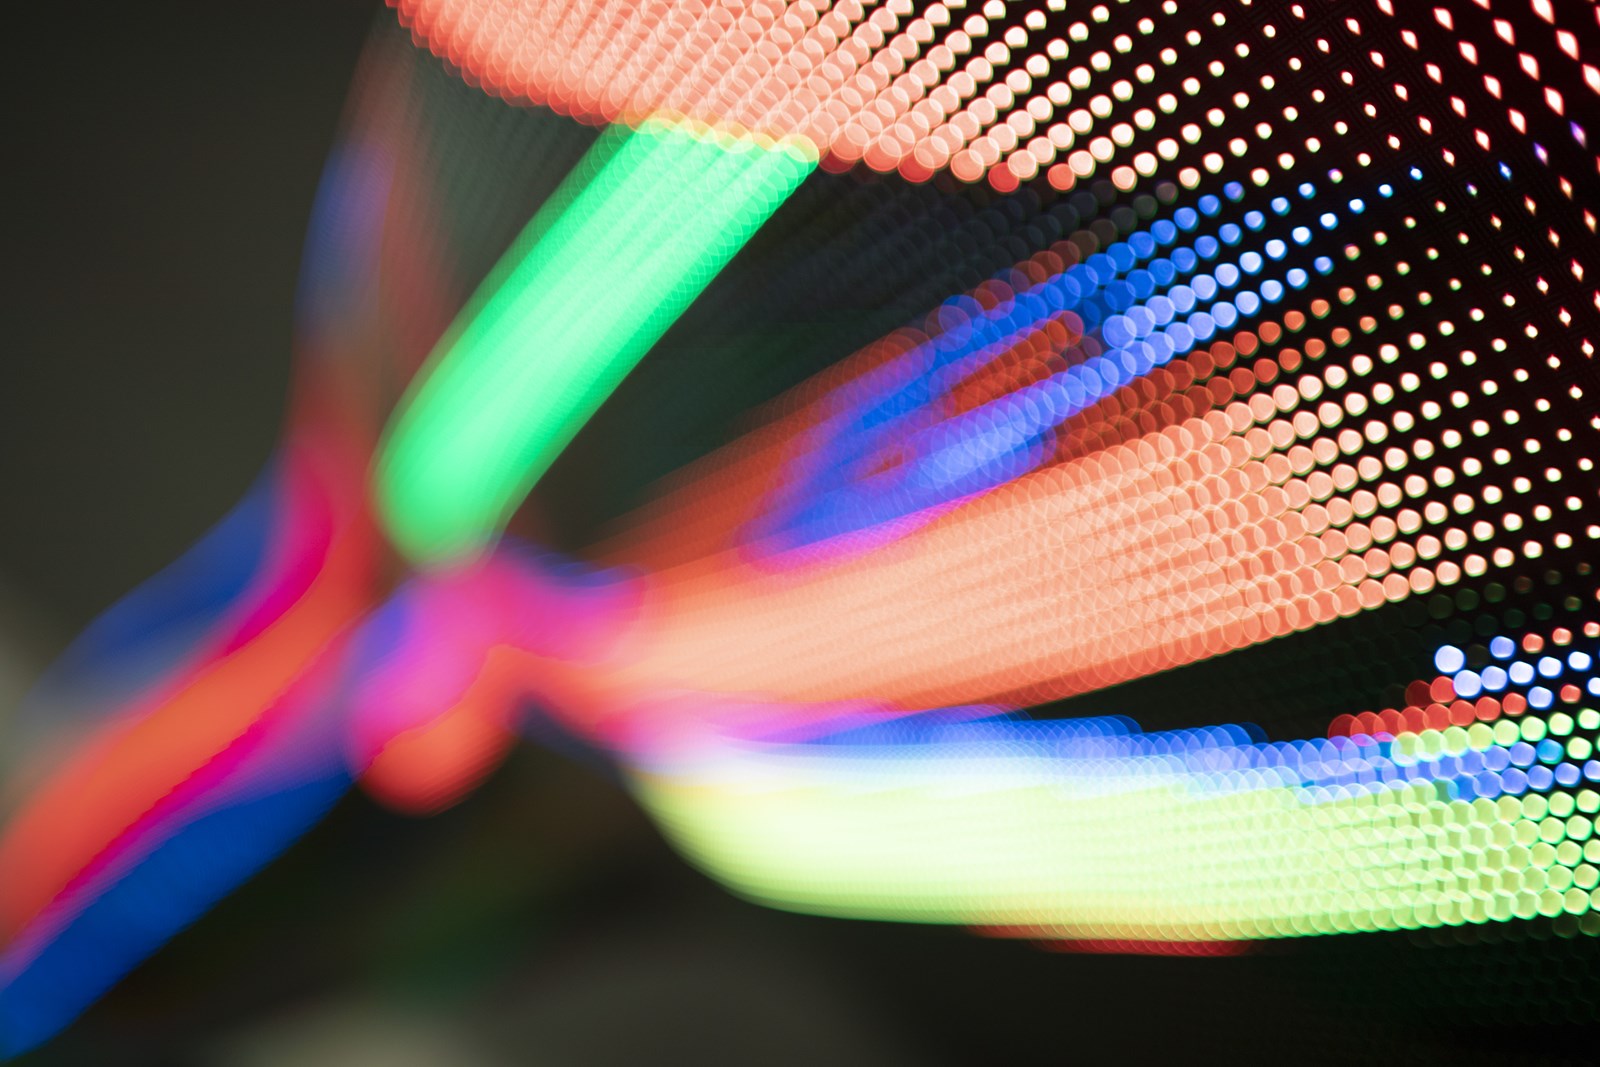
The flow of information is represented via particles that leave trails behind them, creating abstract forms that take the pulse of the searches. Each topic is represented by a color, and the size of each particle varies according to the interest in the topic. Data is pulled from the last week of activity: the faster the particle moves along the screen, the more recent the data is. The screens become conduits of data related to 4 real-time Google searches.
Flexible LED screen, computer, generative custom software, real-time data, metal structure

